WhatsApp Us: +1-(424)-285-0253 or Email Us: Support@bestwritingbay.com

How to Run a Paired Sample T-Test in SPSS

This guide is designed to show you how to run a paired sample t-test in SPSS. You will also learn how to interpret the paired sample t-test SPSS outputs based on a real-world example. Let’s dive in.
What is a Paired Sample T-Test?
A paired sample t-test is a type of inferential statistics test that is designed to test whether there is a difference in means of two related groups. Simply stated, a paired sample t-test is a statistical test that compares the means of two measurements taken either from related groups, same individuals, or same objects over time. A paired t-test is also called the dependent sample t-test.
Common Applications of the Paired Sample T-Test
The paired sample t-test has a lot of applications in various domains. Some of the common areas where it has proven to be beneficial include:
- Medical Research: Researchers use the paired sample t-test to assess the efficacy of a new treatment by comparing pre- and post-treatment measurements on the same patients. This helps determine whether the treatment has a significant impact on the measured outcome.
- Education: In educational research, the paired sample t-test is employed to evaluate the effectiveness of teaching interventions by comparing test scores before and after the intervention. This enables researchers to determine if the intervention has led to any meaningful improvements.
- Market Research: Paired sample t-tests are often used in market research to analyze consumer preferences before and after product modifications or changes in marketing strategies. This allows companies to assess the impact of their actions on consumer perceptions.
- Psychology: Psychological studies frequently employ the paired sample t-test to evaluate the effects of therapeutic interventions or experimental manipulations on psychological variables, such as anxiety levels or self-esteem.
Assumptions
Generally, before running a dependent sample t-test in SPSS, you need to understand and test several assumptions. However, you should not be surprised when some of the assumptions are violated. This is not uncommon, especially when you’re working with real-world data. Even if some more assumptions are violated, there is often a solution to overcome this either through data transformation or adopting non-parametric equivalent tests. For instances, if the paired sample t-test assumptions fail, you can adopt the Wilcoxon Signed Rank Test as the non-parametric equivalent.
There are 4 major assumptions that need to be verified before performing a paired t-test in SPSS. These include:
- Assumption #1: The dependent variable should be measured on a continuous scale (either at interval or ratio level). You can learn more about the various types of variables to gain more understanding.
- Assumption #2: There should be one independent variable, consisting of two related categories (matched pairs). Hint: Matched pairs means that the same subjects should be present in both groups.
- Assumption #3: There should be no significant outliers in the differences between the two related groups. This means that you should take the difference between the matched pairs, check whether there are significant outliers, and remove them. The outliers can be checked using a box plot.
- Assumption #4: The distribution of the difference in the dependent variable scores should be approximately normally distributed. This assumption can be test either using the Shapiro-Wilk test or Kolmogorov-Smirnov test. Besides, you can use graphical methods such as histogram, and the normal q-q plot.
NOTE: Assumptions 1 and 2 cannot be tested using SPSS. You can check them through observations.
How to Perform the Paired Sample T-Test in SPSS: A step-by-step Guide
Is this your first time encountering the dependent sample t-test? Are you wondering how you can perform the test using SPSS? Sit back and relax as we provide you with a step-by-step guide on how to perform the test in SPSS.
Paired Sample T-Test Real World Example
Suppose we have a sample of 30 students who undergo a tutoring program to improve their math skills. We measure their math scores before and after the tutoring program. The goal is to determine if there is a significant improvement in math scores after the tutoring program.
Here are the pre-tutoring math scores and post-tutoring math scores for each student in our sample:
| student_id | Pre-score | Post-score |
| 1 | 65 | 72 |
| 2 | 68 | 70 |
| 3 | 75 | 80 |
| 4 | 70 | 74 |
| 5 | 82 | 85 |
| 6 | 77 | 80 |
| 7 | 71 | 75 |
| 8 | 78 | 82 |
| 9 | 68 | 71 |
| 10 | 80 | 86 |
| 11 | 73 | 76 |
| 12 | 75 | 79 |
| 13 | 79 | 82 |
| 14 | 84 | 88 |
| 15 | 70 | 74 |
| 16 | 77 | 79 |
| 17 | 75 | 77 |
| 18 | 72 | 73 |
| 19 | 81 | 85 |
| 20 | 74 | 78 |
| 21 | 76 | 81 |
| 22 | 68 | 70 |
| 23 | 72 | 76 |
| 24 | 79 | 83 |
| 25 | 85 | 87 |
| 26 | 71 | 73 |
| 27 | 75 | 78 |
| 28 | 77 | 80 |
| 29 | 82 | 86 |
| 30 | 78 | 81 |
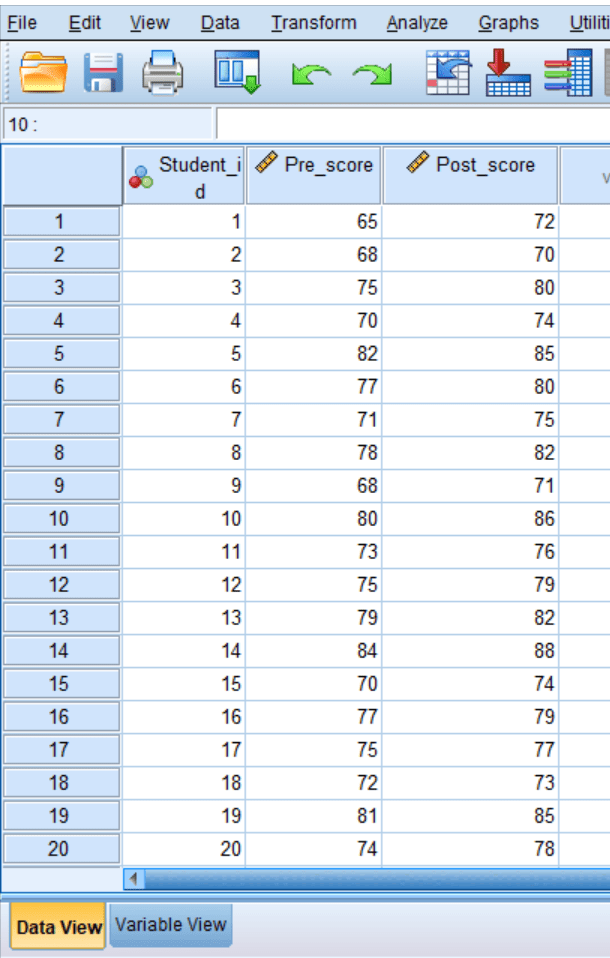
Data preparation in SPSS
For you to perform a paired sample t test using SPSS, you need to make sure the data is organized appropriately. For instance, the above data should be organized in SPSS as shown below:
Test Procedure
- Step 1: With the data open in SPSS, Click Analyze –> Compare Means –> Paired Samples T-test.
The following dialog will appear:
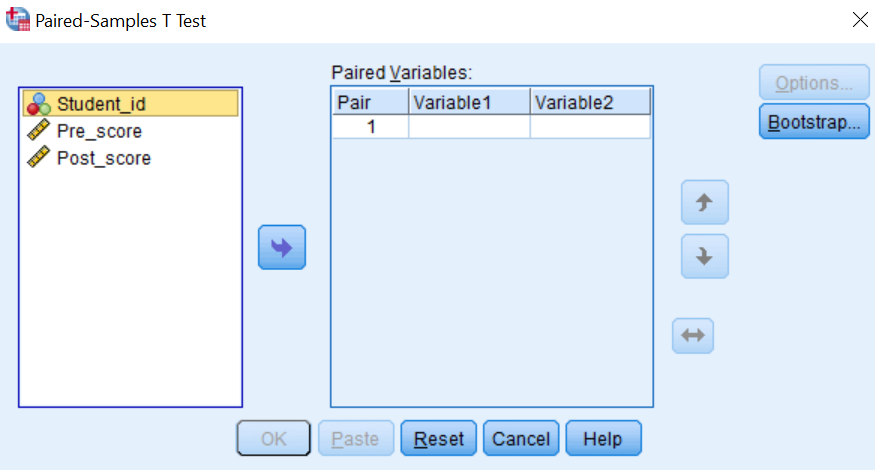
- Step 2: Transfer the pre scores variable and the post scores variable to the “Paired Variables” list as shown below:
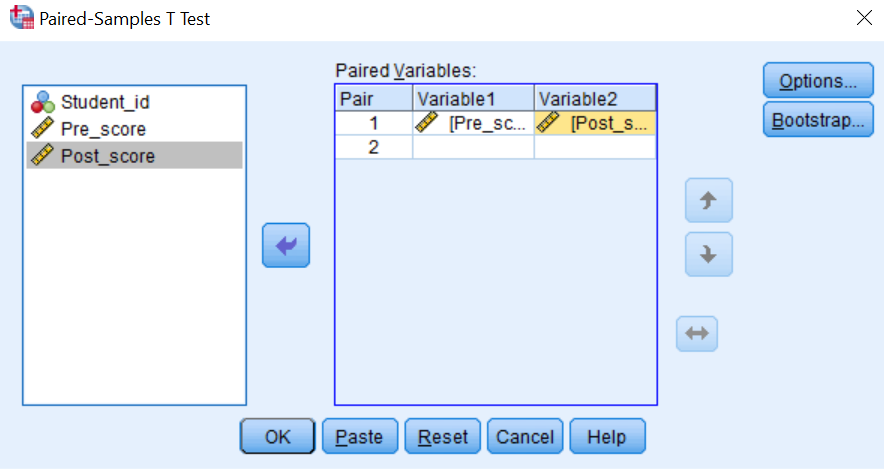
- Step 3: Click Ok button to complete the procedure
How to Interpret Paired Sample T-Test SPSS Outputs
After running the analysis, SPSS will generate an output table. Look for the “Paired Samples Statistics” and “Paired Samples Test” tables. The “Paired Samples Statistics” table provides the means and standard deviations for both pre-tutoring and post-tutoring scores. Here is the spss results:
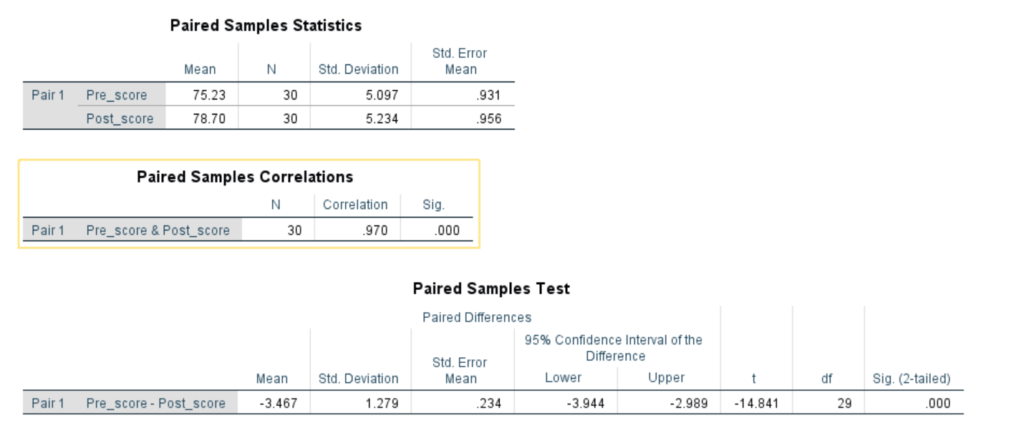
In our example, the mean pre-tutoring score is 75.23, and the mean post-tutoring score is 78.70.The “Paired Samples Test” table displays the t-value, degrees of freedom, and p-value. For our example, the t-value is -14.84, the degrees of freedom is 29, and the p-value is 0.000.
Based on the p-value of 0.000, which is less than 0.05, we can reject the null hypothesis. This indicates that there is a significant improvement in math scores after the tutoring program. The negative t-value of -14.84 suggests that the post-tutoring scores are, on average, significantly lower than the pre-tutoring scores. Therefore, we can interpret the results as evidence that the tutoring program has a positive impact on math performance, leading to statistically significant improvements.
If you missed a step in the above explanation, watch the following short video on paired sample t-test in SPSS and subscribe to our channel for more such videos.
Remember that in practice, it is important to consider the context and practical significance alongside the statistical findings. However, this example demonstrates how to conduct a paired t test in SPSS and interpret the results based on the provided data.
Conclusion
The paired sample t test in SPSS is a robust statistical tool that allows researchers to analyze paired measurements and draw meaningful conclusions about the differences between variables. By following the steps outlined in this guide and considering the assumptions and applications of the test, you can confidently analyze your data and uncover valuable insights. Remember to interpret the results within the context of your research question and consider both statistical and practical significance.
Thus, the paired sample t test in SPSS provides a reliable framework for analyzing paired data, making it a vital tool for researchers and analysts across various disciplines. By harnessing the power of this statistical test, you can unlock deeper insights, strengthen your research findings, and make informed decisions based on rigorous data analysis.
FAQs
Can the paired sample t-test be used with non-numerical variables?
No, the paired sample t-test in SPSS requires numerical data. If your variables are categorical or ordinal, alternative statistical tests should be used, such as the McNemar test for categorical variables.
What is the minimum sample size required for the paired sample t-test in SPSS?
The required sample size depends on various factors, including the desired level of statistical power, effect size, and significance level. Power analysis can help determine the appropriate sample size for your study.
Is it possible to perform a one-tailed paired sample t-test in SPSS?
Yes, SPSS allows you to conduct both one-tailed and two-tailed tests. However, it is important to have a strong theoretical basis for choosing a one-tailed test, as it is a more specific hypothesis.
Can missing data affect the results of the paired sample t-test?
Yes, missing data can impact the accuracy and validity of the test results. It is important to handle missing data appropriately, such as through imputation or exclusion based on well-defined criteria.
Are there any alternatives to the paired sample t test in SPSS?
Yes, if the assumptions of the paired sample t test are violated, non-parametric tests like the Wilcoxon signed-rank test can be used as alternatives. These tests do not assume normality or require equal variances.
Can I perform a paired sample t test with more than two variables in SPSS?
No, the paired sample t test in SPSS is designed for comparing two variables. If you have more than two related variables, you may need to consider other statistical techniques, such as repeated measures ANOVA or multivariate analyses.
“Unlock the power of statistical analysis and make sense of paired data with confidence. Don’t let the complexities of the paired t test hold you back. At Best Writing Bay, we’re here to simplify the process and help you uncover meaningful insights. Our expert writers understand the intricacies of statistical analysis and can provide you with clear, concise, and accurate explanations of the paired t test. Place an order today and let us guide you towards data-driven decision-making, unlocking the potential of your research. Trust Best Writing Bay for reliable, high-quality assistance in understanding and applying the paired t test.”

